

Enrolment Statistics
Staff for Resident Instruction, Research, and Extension
(Not including the business staff and office employes)
| Resident Instruction | 1919-20 | 1920-21 | 1926-27 | 1928-29 | 1929-30 | 1930-31 |
|---|---|---|---|---|---|---|
| Deans (also are Professors) | 6 | 3 | 3 | 3 | 3 | 3 |
| Professors | 31 | 33 | 30 | 30 | 35 | 36 |
| Associate Professors | 9 | 12 | 12 | 16 | 19 | 21 |
| Assistant Professors | 0 | 4 | 20 | 33 | 39 | 38 |
| Instructors | 7 | 12 | 18 | 30 | 24 | 28 |
| Assistants and Fellows | 12 | 8 | 13 | 14 | 24 | 24 |
| Student-Assistants | 11 | 11 | 13 | 8 | 16 | 10 |
| U. S. Army Officers | 4 | 4 | 9 | 9 | 9 | 9 |
| U. S. Army Non-Commissioned Officers | 4 | 8 | 5 | 5 | 5 | 5 |
| Affiliated and Part-time | 0 | 2 | 8 | 4 | 4 | 3 |
| Total | 84 | 97 | 131 | 152 | 178 | 177 |
| Agricultural Experiment Station | 1919-20 | 1920-21 | 1926-27 | 1928-29 | 1929-30 | 1930-31 |
| Director | 1 | 1 | 1 | 1 | 1 | 1 |
| Professors | (7) 7 | (7) 7 | (8) 11 | (8) 10 | (9) 11 | (8) 14 |
| Associate Professors | (3) 5 | (3) 4 | 5 | 6 | 6 | 4 |
| Assistant Professors | 4 | (1) 5 | (2) 6 | (2) 8 | (3) 10 | (8) 17 |
| Instructors | (2) 5 | (2) 3 | (1) 8 | (2) 8 | (1) 5 | 6 |
| Assistants | 0 | 0 | 2 | 0 | 1 | 0 |
| Supervisors of County Stations | 8 | 8 | 8 | 8 | 7 | 8 |
| Total | (12) 30 | (13) 28 | (11) 41 | (12) 41 | (13) 41 | (16) 50 |
| Agricultural Extension Division | 1919-20 | 1920-21 | 1926-27 | 1928-29 | 1929-30 | 1930-31 |
| Director | 1 | 1 | 1 | 1 | 1 | 1 |
| Professors | (1) 5 | (2) 5 | (2) 5 | (2) 6 | (2) 6 | (4) 7 |
| Associate Professors | 8 | (2) 6 | (7) 12 | (4) 9 | (4) 14 | (6) 16 |
| Assistant Professors | 6 | (1) 8 | (2) 13 | (2) 15 | (3) 12 | (3) 15 |
| Instructors | 1 | (1) 2 | (2) 6 | (2) 5 | (3) 6 | (1) 4 |
| Assistants | 0 | (1) 2 | 5 | 0 | 0 | 0 |
| District Farm Demonstration Agents | 5 | 4 | 4 | 5 | 5 | 5 |
| District Home Demonstration Agents | 3 | 3 | 2 | 3 | 4 | 4 |
| District Farm Demonstration Agents (colored) | 2 | 3 | 1 | 2 | 2 | 2 |
| District Home Demonstration Agents (colored) | 1 | 1 | 1 | 1 | 1 | 1 |
| County Farm Demonstration Agents | 53 | 62 | 71 | 72 | 77 | 85 |
| County Home Demonstration Agents | 29 | 24 | (1) 32 | 37 | 38 | 46 |
| Local Farm Demonstration Agents (colored) | 22 | 20 | 24 | 20 | 20 | 21 |
| Local Home Demonstration Agents (colored) | 7 | 7 | 6 | 6 | 6 | 6 |
| Total | (1) 143 | (7) 148 | (14) 183 | (10) 182 | (12) 192 | (8) 213 |
| Grand Total | 244 | 253 | 330 | 353 | 386 | 416 |
() Numbers in parentheses are also included under another division, so indicate duplicates. These duplicates are omitted in the grand total. Many of the resident instruction group devote only a part of their time to teaching, the rest being given to experiment station or extension division service.
Students by Curricula
| Curriculum | 1919-20 | 1924-25 | 1926-27 | 1928-29 | 1929-30 | 1930-31 |
|---|---|---|---|---|---|---|
| General Agriculture | 80 | …… | …… | …… | …… | …… |
| Agricultural Economics | …… | …… | 2 | 12 | 22 | 36 |
| Agricultural Education | 42 | 17 | 84 | 97 | 105 | 105 |
| Agricultural Engineering | 3 | 3 | 26 | 39 | 50 | 51 |
| Agronomy | …… | 47 | 18 | 35 | 36 | 41 |
| Animal Husbandry | …… | 44 | 16 | 21 | 23 | 22 |
| Dairy Husbandry | …… | 6 | 13 | 22 | 23 | 31 |
| Horticulture | 5 | 13 | 17 | 23 | 18 | 22 |
| Home Economics | …… | …… | 15 | 25 | 26 | 29 |
| Architectural Engineering | …… | …… | …… | …… | 34 | 51 |
| Chemical Engineering | 46 | 45 | 44 | 75 | 103 | 138 |
| Civil Engineering | 79 | 77 | 142 | 140 | 115 | 108 |
| Electrical Engineering | 173 | 182 | 324 | 272 | 251 | 284 |
| Engineering Geology | 2 | 3 | 5 | 5 | 6 | 6 |
| Industrial Engineering | …… | …… | …… | …… | 65 | 78 |
| Mechanical Engineering | 131 | 130 | 113 | 108 | 129 | 156 |
| Mining Engineering | 13 | 21 | 29 | 16 | 19 | 22 |
| Business Administration | …… | …… | 181 | 257 | 278 | 275 |
| Commercial Engineering | …… | …… | 60 | 67 | 3 | …… |
| Industrial Education | …… | 29 | …… | …… | …… | …… |
| Secretarial Training | …… | …… | 3 | 0 | 0 | 1 |
| General Science | 12 | …… | …… | …… | …… | …… |
| Biological Sciences | 12 | 17 | 27 | 36 | 39 | 41 |
| Chemistry | 9 | 6 | 18 | 13 | 18 | 29 |
| Metallurgy | 3 | 1 | 2 | 6 | 5 | 7 |
| Physics | 1 | …… | …… | …… | …… | …… |
| Pre-Dental | …… | …… | 10 | 6 | 5 | 12 |
| Pre-Law | …… | …… | 17 | 12 | 13 | 16 |
| Pre-Medical | …… | …… | 25 | 25 | 30 | 30 |
| Pre-Pharmacy | …… | …… | 2 | 1 | …… | 1 |
| 2-year Agriculture | 92 | 121 | …… | …… | …… | …… |
| U. S. Veterans’ Bureau Special Agriculture | 52 | 27 | …… | …… | …… | …… |
| Special and Unclassified Students | …… | 4 | 0 | 0 | 0 | 4 |
| Part-time Students | …… | …… | 13 | 21 | 24 | 21 |
| Total | 755 | 793 | 1,206 | 1,334 | 1,440 | 1,617 |
| Group | 1919-20 | 1920-21 | 1926-27 | 1928-29 | 1929-30 | 1930-31 |
|---|---|---|---|---|---|---|
| Graduate Students | 18 | 14 | 47 | 70 | 96 | 100 |
| Seniors | 88 | 88 | 175 | 214 | 234 | 241 |
| Juniors | 82 | 130 | 224 | 224 | 226 | 255 |
| Sophomores | 162 | 159 | 291 | 307 | 327 | 366 |
| Freshmen | 247 | 250 | 462 | 506 | 545 | 639 |
| 2d-year, 2-year Agriculture | 18 | 37 | …… | …… | …… | …… |
| 1st-year, 2-year Agriculture | 74 | 84 | …… | …… | …… | …… |
| U. S. Veterans’ Bureau and Unclassified | 66 | 31 | 7 | 13 | 12 | 16 |
| Total | 755 | 793 | 1,206 | 1,334 | 1,440 | 1,617 |
| Winter Short Course | 30 | 53 | 18 | 58 | 55 | 42 |
| Summer Session | …… | …… | 184 | 289 | 304 | 364 |
| Total for Year | 785 | 846 | 1,408 | 1,681 | 1,799 | 2,023 |
Note-Where a blank occurs in the above tables the curriculum was not offered in that year; and where a cipher occurs the curriculum was offered but no students were registered in it.
Students by States and Countries
| State or Country | 1919-20 | 1920-21 | 1926-27 | 1928-29 | 1929-30 | 1930-31 |
|---|---|---|---|---|---|---|
| Alabama | 2 | 2 | 1 | 0 | 2 | 1 |
| California | 0 | 1 | 0 | 0 | 0 | 0 |
| Colorado | 0 | 0 | 0 | 0 | 0 | 2 |
| Connecticut | 0 | 0 | 0 | 4 | 5 | 8 |
| Delaware | 0 | 0 | 2 | 3 | 4 | 5 |
| District of Columbia | 2 | 3 | 7 | 13 | 16 | 14 |
| Florida | 0 | 0 | 2 | 1 | 2 | 2 |
| Georgia | 2 | 1 | 2 | 1 | 3 | 2 |
| Illinois | 0 | 0 | 0 | 1 | 1 | 4 |
| Indiana | 0 | 0 | 1 | 0 | 0 | 2 |
| Iowa | 0 | 0 | 2 | 0 | 0 | 2 |
| Kansas | 0 | 0 | 1 | 0 | 0 | 0 |
| Kentucky | 5 | 3 | 4 | 3 | 7 | 10 |
| Louisiana | 0 | 0 | 2 | 2 | 1 | 0 |
| Maryland | 4 | 6 | 6 | 6 | 10 | 17 |
| Massachusetts | 0 | 2 | 0 | 0 | 1 | 1 |
| Michigan | 1 | 1 | 1 | 2 | 5 | 2 |
| Minnesota | 0 | 0 | 1 | 0 | 0 | 0 |
| Mississippi, | 1 | 0 | 0 | 0 | 1 | 0 |
| Missouri, | 0 | 0 | 2 | 3 | 2 | 0 |
| New Jersey | 2 | 2 | 3 | 4 | 6 | 12 |
| New York | 0 | 0 | 2 | 6 | 10 | 21 |
| North Carolina | 3 | 5 | 15 | 11 | 12 | 12 |
| Ohio | 0 | 0 | 6 | 10 | 8 | 7 |
| Oklahoma | 0 | 0 | 0 | 0 | 0 | 1 |
| Pennsylvania | 1 | 4 | 6 | 8 | 20 | 25 |
| South Carolina | 7 | 4 | 4 | 5 | 5 | 5 |
| Tennessee | 3 | 4 | 13 | 12 | 13 | 11 |
| Texas | 1 | 2 | 0 | 0 | 1 | 1 |
| West Virginia | 18 | 17 | 41 | 46 | 61 | 75 |
| Wisconsin | 0 | 0 | 0 | 1 | 2 | 0 |
| Canada | 0 | 0 | 0 | 0 | 0 | 1 |
| China | 0 | 1 | 1 | 1 | 1 | 0 |
| France | 0 | 0 | 1 | 0 | 0 | 0 |
| Mexico | 0 | 2 | 0 | 0 | 1 | 1 |
| Philippine Islands | 0 | 0 | 1 | 1 | 0 | 0 |
| Porto Rico | 2 | 1 | 0 | 0 | 0 | 1 |
| Russia | 0 | 0 | 0 | 1 | 1 | 1 |
| Switzerland | 0 | 0 | 0 | 1 | 1 | 0 |
| VIRGINIA. | 701 | 732 | 1,097 | 1,246 | 1,293 | 1,413 |
| Total | 755 | 793 | 1,224 | 1,392 | 1,495 | 1,659 |
Typical Annual Distribution of Virginia Students by Counties
(The cities are included in the counties)
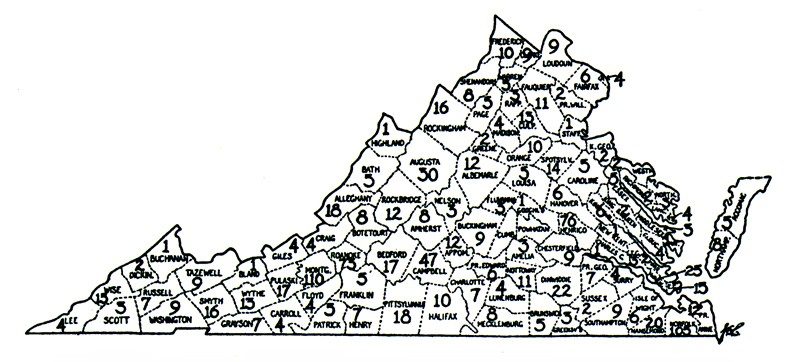
This distribution is on the basis of 1,099 students. The average for a period of years was taken as the basis. While the enrolment in later years is much greater the relative distribution is fairly represented in this diagram.
Graduates by Curricula
| Curriculum | 1919-20 | 1920-21 | 1926-27 | 1928-29 | 1929-30 | 1930-31 |
|---|---|---|---|---|---|---|
| General Agriculture | 21 | …… | …… | …… | …… | …… |
| Agricultural Economics | …… | …… | …… | 0 | 0 | 0 |
| Agricultural Education | 6 | 2 | 12 | 11 | 18 | 17 |
| Agricultural Engineering | …… | 3 | 3 | 10 | 9 | 7 |
| Agronomy | …… | 2 | 5 | 4 | 7 | 3 |
| Animal Husbandry | …… | 5 | 4 | 1 | 3 | 4 |
| Dairy Husbandry | …… | 1 | 1 | 3 | 3 | 5 |
| Horticulture | 1 | 0 | 3 | 4 | 2 | 5 |
| Home Economics | …… | …… | …… | 4 | 5 | 2 |
| Architectural Engineering | …… | …… | …… | …… | 2 | 10 |
| Chemical Engineering | 8 | 11 | 6 | 7 | 9 | 16 |
| Civil Engineering | 9 | 16 | 19 | 19 | 18 | 26 |
| Electrical Engineering | 17 | 14 | 39 | 40 | 37 | 34 |
| Industrial Engineering | …… | …… | …… | …… | 15 | 10 |
| Mechanical Engineering | 14 | 14 | 17 | 12 | 23 | 11 |
| Mining Engineering | 1 | 0 | 7 | 3 | 3 | 7 |
| Business Administration | …… | …… | 7 | 32 | 42 | 39 |
| Commercial Engineering | …… | …… | 16 | 18 | 4 | …… |
| Industrial Education | …… | 2 | 1 | …… | …… | …… |
| Secretarial Work | …… | …… | 1 | 0 | 0 | 1 |
| Biological Sciences | 0 | 1 | 3 | 2 | 7 | 8 |
| Chemistry | 2 | 4 | 4 | 5 | 0 | 5 |
| Geology | 0 | 0 | 1 | 2 | 1 | 0 |
| Metallurgy | 0 | 0 | 0 | 1 | 0 | 3 |
| Total | 79 | 75 | 149 | 178 | 208 | 213 |
Note -- Where a blank occurs in this table the curriculum was not offered in that year; and where a cipher occurs the curriculum was offered but there was no graduate in it.
Graduate Degrees Conferred
| Degree | 1919-20 | 1920-21 | 1926-27 | 1928-29 | 1929-30 | 1930-31 |
|---|---|---|---|---|---|---|
| Master of Science | 3 | 4 | 9 | 9 | 15 | 25 |
| Chemical Engineer | 1 | 1 | 0 | 0 | 0 | 0 |
| Civil Engineer | 0 | 3 | 0 | 2 | 2 | 1 |
| Electrical Engineer | 2 | 0 | 3 | 4 | 2 | 1 |
| Mechanical Engineer | 1 | 0 | 2 | 2 | 0 | 1 |
| Mining Engineer (E.M.) | 0 | 0 | 0 | 0 | 0 | 0 |
| Total | 7 | 8 | 14 | 17 | 19 | 28 |
| Group | 1924-25 | 1926-27 | 1928-29 | 1929-30 | 1930-31 |
|---|---|---|---|---|---|
| Farm Women as Demonstrators | 8,226 | 5,959 | 5,220 | 6,814 | 25,497 |
| Farmers as Demonstrators | 14,765 | 18,926 | 22,946 | 27,432 | 22,872 |
| Farm Women in Clubs | 2,077 | 3,796 | 3,982 | 4,805 | 7,149 |
| Farmers in Clubs | 6,188 | 7,846 | 6,212 | 6,045 | 2,107 |
| Boys and Girls in Clubs | 14,339 | 15,516 | 15,545 | 19,087 | 23,194 |
| Boys and Girls in Summer Courses | 2,055 | 2,056 | 2,246 | 2,397 | 2,349 |
| Leaders and Agents in Summer Courses | …… | 307 | 239 | 346 | 284 |
| Institute and Conference Attendance | 151,360 | 186,988 | 209,892 | 200,000 | 200,000 |