

Enrolment Statistics
Enrolment Statistics
Staff for Resident Instruction, Research, and Extension
(Not including the business staff and office employes)
| Resident Instruction | 1919-20 | 1920-21 | 1924-25 | 1926-27 | 1928-29 | 1929-30 |
|---|---|---|---|---|---|---|
| Deans (also are Professors) | 6 | 3 | 3 | 3 | 3 | 3 |
| Professors | 31 | 33 | 32 | 30 | 30 | 35 |
| Associate Professors | 9 | 12 | 15 | 12 | 16 | 19 |
| Assistant Professors | 0 | 4 | 14 | 20 | 33 | 39 |
| Instructors | 7 | 12 | 23 | 18 | 30 | 24 |
| Assistants and Fellows | 12 | 8 | 15 | 13 | 14 | 24 |
| Student-Assistants | 11 | 11 | 15 | 13 | 8 | 16 |
| U. S. Army Officers | 4 | 4 | 8 | 9 | 9 | 9 |
| U. S. Army Non-Commissioned Officers | 4 | 8 | 4 | 5 | 5 | 5 |
| Affiliated and Part-time | 0 | 2 | 4 | 8 | 4 | 4 |
| Total | 84 | 97 | 133 | 131 | 152 | 118 |
| ||||||
| Agricultural Experiment Station | 1919-20 | 1920-21 | 1924-25 | 1926-27 | 1928-29 | 1929-30 |
| Director | 1 | 1 | 1 | 1 | 1 | 1 |
| Professors | (7) 7 | (7) 7 | (9) 9 | (8) 11 | (8) 10 | (9) 11 |
| Associate Professors | (3) 5 | (3) 4 | 3 | 5 | 6 | 6 |
| Assistant Professors | 4 | (1) 5 | 6 | (2) 6 | (2) 8 | (3) 10 |
| Instructors | (2) 5 | (2) 3 | 4 | (1) 8 | (2) 8 | (1) 5 |
| Assistants | 0 | 0 | 1 | 2 | 0 | 1 |
| Supervisors of County Stations | 8 | 8 | 8 | 8 | 8 | 7 |
| Total | (12) 30 | (13) 28 | (9) 32 | (11) 41 | (12) 41 | (13) 41 |
| ||||||
| Agricultural Extension Division | 1919-20 | 1920-21 | 1924-25 | 1926-27 | 1928-29 | 1929-30 |
| Director | 1 | 1 | 1 | 1 | 1 | 1 |
| Professors | (1) 5 | (2) 5 | (2) 4 | (2) 5 | (2) 6 | (2) 6 |
| Associate Professors | 8 | (2) 6 | (5) 9 | (7) 12 | (4) 9 | (4) 14 |
| Assistant Professors | 6 | (1) 8 | (4) 12 | (2) 13 | (2) 15 | (3) 12 |
| Instructors | 1 | (1) 2 | (1) 6 | (2) 6 | (2) 5 | (3) 6 |
| Assistants | 0 | (1) 2 | 1 | 5 | 0 | 0 |
| District Farm Demonstration Agents | 5 | 4 | 5 | 4 | 5 | 5 |
| District Home Demonstration Agents | 3 | 3 | 3 | 2 | 3 | 4 |
| District Farm Demonstration Agents (colored) | 2 | 3 | 2 | 1 | 2 | 2 |
| District Home Demonstration Agents (colored) | 1 | 1 | 1 | 1 | 1 | 1 |
| County Farm Demonstration Agents | 53 | 62 | 64 | 71 | 72 | 77 |
| County Home Demonstration Agents | 29 | 24 | 36 | (1) 32 | 37 | 38 |
| Local Farm Demonstration Agents (colored) | 22 | 20 | 23 | 24 | 20 | 20 |
| Local Home Demonstration Agents (colored) | 7 | 7 | 6 | 6 | 6 | 6 |
| Total | (1) 143 | (7) 148 | (12) 173 | (14) 183 | (10) 182 | (12) 192 |
| Grand Total | 244 | 253 | 317 | 330 | 353 | 386 |
() Numbers in parentheses are also included under another division, so indicate duplicates. These duplicates are omitted in the grand total. Many of the resident instruction group devote only a part of their time to teaching, the rest being given to experiment station or extension division service.
Students by Curricula
| Curriculum | 1919-20 | 1920-21 | 1924-25 | 1926-27 | 1928-29 | 1929-30 |
|---|---|---|---|---|---|---|
| General Agriculture | 80 | …… | …… | …… | …… | …… |
| Agricultural Economics | …… | …… | 1 | 2 | 12 | 22 |
| Agricultural Education | 42 | 17 | 62 | 84 | 97 | 105 |
| Agricultural Engineering | 3 | 3 | 35 | 26 | 39 | 50 |
| Agronomy | …… | 47 | 42 | 18 | 35 | 36 |
| Animal Husbandry | …… | 44 | 26 | 16 | 21 | 23 |
| Dairy Husbandry | …… | 6 | 16 | 13 | 22 | 23 |
| Horticulture | 5 | 13 | 28 | 17 | 23 | 18 |
| Home Economics | …… | …… | …… | 15 | 25 | 26 |
| Architectural Engineering | …… | …… | …… | …… | …… | 34 |
| Chemical Engineering | 46 | 45 | 44 | 44 | 75 | 103 |
| Civil Engineering | 79 | 77 | 137 | 142 | 140 | 115 |
| Electrical Engineering | 173 | 182 | 270 | 324 | 272 | 251 |
| Industrial Engineering | …… | …… | …… | …… | …… | 65 |
| Mechanical Engineering | 131 | 130 | 120 | 113 | 108 | 129 |
| Mining Engineering | 13 | 21 | 25 | 29 | 16 | 19 |
| Business Administration | …… | …… | 84 | 181 | 257 | 278 |
| Commercial Engineering | …… | …… | 60 | 60 | 67 | 3 |
| Industrial Education | …… | 29 | 20 | …… | …… | …… |
| Secretarial Training | …… | …… | 3 | 3 | 0 | 0 |
| General Science | 12 | …… | …… | …… | …… | …… |
| Biological Sciences | 12 | 17 | 21 | 27 | 36 | 39 |
| Chemistry | 9 | 6 | 16 | 18 | 13 | 18 |
| Geology | 2 | 3 | 5 | 5 | 5 | 6 |
| Metallurgy | 3 | 1 | 3 | 2 | 6 | 5 |
| Physics | 1 | …… | …… | …… | …… | …… |
| Pre-Dental | …… | …… | 8 | 10 | 6 | 5 |
| Pre-Law | …… | …… | 17 | 17 | 12 | 13 |
| Pre-Medical | …… | …… | 21 | 25 | 25 | 30 |
| Pre-Pharmacy | …… | …… | 0 | 2 | 1 | …… |
| 2-year Agriculture | 92 | 121 | …… | …… | …… | …… |
| U. S. Veterans’ Bureau Special Agriculture | 52 | 27 | 96 | …… | …… | …… |
| Special and Unclassified Students | …… | 4 | 13 | 0 | 0 | 0 |
| Part-time Students | …… | …… | 18 | 13 | 21 | 24 |
| Total | 755 | 793 | 1,191 | 1,206 | 1,334 | 1,440 |
Students by Class Groups
| Group | 1919-20 | 1920-21 | 1924-25 | 1926-27 | 1928-29 | 1929-30 |
|---|---|---|---|---|---|---|
| Graduate Students | 18 | 14 | 42 | 47 | 70 | 96 |
| Seniors | 88 | 88 | 179 | 175 | 214 | 234 |
| Juniors | 82 | 130 | 156 | 224 | 224 | 226 |
| Sophomores | 162 | 159 | 229 | 291 | 307 | 327 |
| Freshmen | 247 | 250 | 460 | 462 | 506 | 545 |
| 2d-year, 2-year Agriculture | 18 | 37 | …… | …… | …… | …… |
| 1st-year, 2-year Agriculture | 74 | 84 | …… | …… | …… | …… |
| U. S. Veterans’ Bureau and Unclassified | 66 | 31 | 125 | 7 | 13 | 12 |
| Total | 755 | 793 | 1,191 | 1,206 | 1,334 | 1,440 |
| Winter Short Course | 30 | 53 | 21 | 18 | 58 | 55 |
| Summer Session | …… | …… | 177 | 184 | 289 | 304 |
| Total for Year | 785 | 846 | 1,389 | 1,408 | 1,681 | 1,799 |
Note-Where a blank occurs in the above tables the curriculum was not offered in that year; and where a cipher occurs the curriculum was offered but no students were registered in it.
Students by States and Countries
| State or Country | 1919-20 | 1920-21 | 1924-25 | 1926-27 | 1928-29 | 1929-30 |
|---|---|---|---|---|---|---|
| Alabama | 2 | 2 | 1 | 1 | 0 | 2 |
| California | 0 | 1 | 0 | 0 | 0 | 0 |
| Connecticut | 0 | 0 | 0 | 0 | 4 | 5 |
| Delaware | 0 | 0 | 0 | 2 | 3 | 4 |
| District of Columbia | 2 | 3 | 7 | 7 | 13 | 16 |
| Florida | 0 | 0 | 1 | 2 | 1 | 2 |
| Georgia | 2 | 1 | 5 | 2 | 1 | 3 |
| Illinois | 0 | 0 | 0 | 0 | 1 | 1 |
| Indiana | 0 | 0 | 1 | 1 | 0 | 0 |
| Iowa | 0 | 0 | 1 | 2 | 0 | 0 |
| Kansas | 0 | 0 | 0 | 1 | 0 | 0 |
| Kentucky | 5 | 3 | 11 | 4 | 3 | 7 |
| Louisiana | 0 | 0 | 2 | 2 | 2 | 1 |
| Maryland | 4 | 6 | 10 | 6 | 6 | 10 |
| Massachusetts | 0 | 2 | 1 | 0 | 0 | 1 |
| Michigan | 1 | 1 | 0 | 1 | 2 | 5 |
| Minnesota | 0 | 0 | 1 | 1 | 0 | 0 |
| Mississippi, | 1 | 0 | 0 | 0 | 0 | 1 |
| Missouri, | 0 | 0 | 0 | 2 | 3 | 2 |
| New Jersey | 2 | 2 | 5 | 3 | 4 | 6 |
| New York | 0 | 0 | 2 | 2 | 6 | 10 |
| North Carolina | 3 | 5 | 11 | 15 | 11 | 12 |
| Ohio | 0 | 0 | 3 | 6 | 10 | 8 |
| Oklahoma | 0 | 0 | 1 | 0 | 0 | 0 |
| Pennsylvania | 1 | 4 | 8 | 6 | 8 | 20 |
| South Carolina | 7 | 4 | 3 | 4 | 5 | 5 |
| Tennessee | 3 | 4 | 8 | 13 | 12 | 13 |
| Texas | 1 | 2 | 0 | 0 | 0 | 1 |
| West Virginia | 18 | 17 | 28 | 41 | 46 | 61 |
| Wisconsin | 0 | 0 | 0 | 0 | 1 | 2 |
| China | 0 | 1 | 1 | 1 | 1 | 1 |
| Colombia | 0 | 0 | 1 | 0 | 0 | 0 |
| France | 0 | 0 | 0 | 1 | 0 | 0 |
| Mexico | 0 | 2 | 0 | 0 | 0 | 1 |
| Philippine Islands | 0 | 0 | 0 | 1 | 1 | 0 |
| Porto Rico | 2 | 1 | 0 | 0 | 0 | 0 |
| Russia | 0 | 0 | 0 | 0 | 1 | 1 |
| Switzerland | 0 | 0 | 0 | 0 | 1 | 1 |
| VIRGINIA. | 701 | 732 | 1,079 | 1,097 | 1,246 | 1,293 |
| Total | 755 | 793 | 1,191 | 1,224 | 1,392 | 1,495 |
Typical Annual Distribution of Virginia Students by Counties
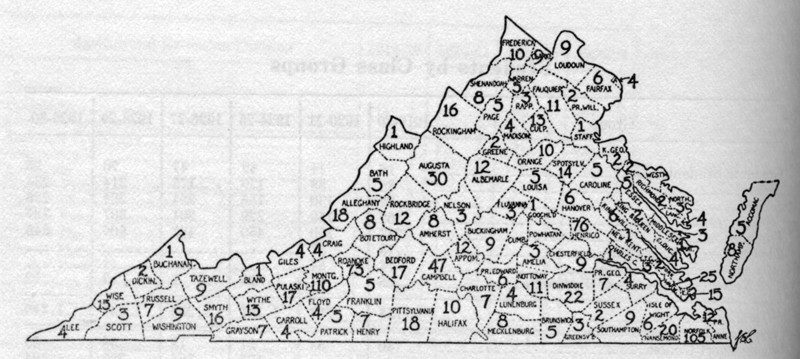
(The cities are included in the counties)
This distribution is on the basis of 1,099 students. The number of Virginia students enrolled in 1927-28 was 1,167 and the number in 1928-29 was 1,246. The average for a period of years was taken as the basis.
Graduates by Curricula
| Curriculum | 1919-20 | 1920-21 | 1924-25 | 1926-27 | 1928-29 | 1929-30 |
|---|---|---|---|---|---|---|
| General Agriculture | 21 | …… | …… | …… | …… | …… |
| Agricultural Economics | …… | …… | …… | …… | 0 | 0 |
| Agricultural Education | 6 | 2 | 6 | 12 | 11 | 18 |
| Agricultural Engineering | …… | 3 | 13 | 3 | 10 | 9 |
| Agronomy | …… | 2 | 7 | 5 | 4 | 7 |
| Animal Husbandry | …… | 5 | 4 | 4 | 1 | 3 |
| Dairy Husbandry | …… | 1 | 3 | 1 | 3 | 3 |
| Horticulture | 1 | 0 | 6 | 3 | 4 | 2 |
| Home Economics | …… | …… | …… | …… | 4 | 5 |
| Architectural Engineering | …… | …… | …… | …… | …… | 2 |
| Chemical Engineering | 8 | 11 | 7 | 6 | 7 | 9 |
| Civil Engineering | 9 | 16 | 18 | 19 | 19 | 18 |
| Electrical Engineering | 17 | 14 | 33 | 39 | 40 | 37 |
| Industrial Engineering | …… | …… | …… | …… | …… | 15 |
| Mechanical Engineering | 14 | 14 | 14 | 17 | 12 | 23 |
| Mining Engineering | 1 | 0 | 7 | 7 | 3 | 3 |
| Business Administration | …… | …… | …… | 7 | 32 | 42 |
| Commercial Engineering | …… | …… | 7 | 16 | 18 | 4 |
| Industrial Education | …… | 2 | 4 | 1 | …… | …… |
| Secretarial Work | …… | …… | …… | 1 | 0 | 0 |
| Biological Sciences | 0 | 1 | 5 | 3 | 2 | 7 |
| Chemistry | 2 | 4 | 4 | 4 | 5 | 0 |
| Geology | 0 | 0 | 1 | 1 | 2 | 1 |
| Metallurgy | 0 | 0 | 2 | 0 | 1 | 0 |
| Total | 79 | 75 | 141 | 149 | 178 | 208 |
Note -- Where a blank occurs in this table the curriculum was not offered in that year; and where a cipher occurs the curriculum was offered but there was no graduate in it.
Graduate Degrees Conferred
| Degree | 1919-20 | 1920-21 | 1924-25 | 1926-27 | 1928-29 | 1929-30 |
|---|---|---|---|---|---|---|
| Master of Science | 3 | 4 | 6 | 9 | 9 | 15 |
| Chemical Engineer | 1 | 1 | 0 | 0 | 0 | 0 |
| Civil Engineer | 0 | 3 | 0 | 0 | 2 | 2 |
| Electrical Engineer | 2 | 0 | 2 | 3 | 4 | 2 |
| Mechanical Engineer | 1 | 0 | 2 | 2 | 2 | 0 |
| Mining Engineer (E.M.) | 0 | 0 | 0 | 0 | 0 | 0 |
| Total | 7 | 8 | 10 | 14 | 17 | 19 |
Agricultural Extension Enrolment
| Group | 1924-25 | 1926-27 | 1928-29 | 1929-30 |
|---|---|---|---|---|
| Farm Women as Demonstrators | 8,226 | 5,959 | 5,220 | 6,814 |
| Farmers as Demonstrators | 14,765 | 18,926 | 22,946 | 27,432 |
| Farm Women in Clubs | 2,077 | 3,796 | 3,982 | 4,805 |
| Farmers in Clubs | 6,188 | 7,846 | 6,212 | 6,045 |
| Boys and Girls in Clubs | 14,339 | 15,516 | 15,545 | 19,087 |
| Boys and Girls in Summer Courses | 2,055 | 2,056 | 2,246 | 2,397 |
| Leaders and Agents in Summer Courses | …… | 307 | 239 | 346 |
| Institute and Conference Attendance | 151,360 | 186,988 | 209,892 | 200,000 |