

Enrolment Statistics
Staff for Resident Instruction, Research, and Extension
(Not including the business staff and office employes)
| Resident Instruction | 1919-20 | 1920-21 | 1921-22 | 1922-23 | 1923-24 | 1924-25 |
|---|---|---|---|---|---|---|
| Deans (also are Profs.) | 6 | 3 | 3 | 3 | 4 | 3 |
| Professors | 31 | 33 | 32 | 31 | 34 | 32 |
| Associate Professors | 9 | 12 | 12 | 13 | 12 | 15 |
| Assistant Professors | 0 | 4 | 11 | 12 | 10 | 14 |
| Instructors | 7 | 12 | 19 | 22 | 18 | 23 |
| Assistants | 12 | 8 | 11 | 15 | 19 | 15 |
| Student-Assistants | 11 | 11 | 6 | 9 | 9 | 15 |
| U. S. Army Officers | 4 | 4 | 7 | 8 | 8 | 8 |
| U. S. A. Non-Commis. Offics. | 4 | 8 | 7 | 5 | 5 | 4 |
| Affiliated & Part-time | 0 | 2 | 3 | 2 | 3 | 4 |
| Total | 84 | 97 | 111 | 120 | 122 | 133 |
Experiment Station | ||||||
| Director | 1 | 1 | 1 | 1 | 1 | 1 |
| Professors | (7) 7 | (7) 7 | (7) 7 | (7) 8 | (10) 10 | (9) 9 |
| Associate Professors | (3) 5 | (3) 4 | (3) 4 | (4) 5 | (1) 2 | 3 |
| Assistant Professors | 4 | (1) 5 | (1) 7 | (1) 8 | 7 | 6 |
| Instructors | (2) 5 | (2) 3 | (1) 2 | (1) 2 | (1) 4 | 4 |
| Assistants | 0 | 0 | 0 | 0 | 1 | 1 |
| Supervisors County Stas. | 8 | 8 | 8 | 8 | 8 | 8 |
| Total | (12) 30 | (13) 28 | (12) 29 | (13) 32 | (12) 33 | (9) 32 |
Extension Division | ||||||
| Director | 1 | 1 | 1 | 1 | 1 | 1 |
| Professors | (1) 5 | (2) 5 | (2) 5 | (2) 5 | (4) 7 | (2) 4 |
| Associate Professors | 8 | (2) 6 | (3) 8 | (4) 11 | (3) 9 | (5) 9 |
| Assistant Professors | 6 | (1) 8 | (1) 11 | (1) 9 | (1) 8 | (4) 12 |
| Instructors | 1 | (1) 2 | (3) 4 | (2) 5 | (1) 7 | (1) 6 |
| Assistants | 0 | (1) 2 | 1 | 1 | 1 | 1 |
| District Farm Dem. Agts. | 5 | 4 | 4 | 5 | 5 | 5 |
| District Home Dem. Agts. | 3 | 3 | 3 | 3 | 3 | 3 |
| Dist. Fm. Dem. Agts. (col.) | 2 | 3 | 3 | 2 | 2 | 2 |
| Dist. Home Dem. Agts. (col.) | 1 | 1 | 1 | 1 | 1 | 1 |
| County Farm Dem. Agts | 53 | 62 | 66 | 70 | 68 | 64 |
| County Home Dem. Agts | 29 | 24 | 22 | 36 | 36 | 36 |
| Local Farm Dem. Agts. (col.) | 22 | 20 | 20 | 24 | 24 | 23 |
| Local Home Dem. Agts. (col.) | 7 | 7 | 7 | 7 | 7 | 6 |
| Total | (1) 143 | (7) 148 | (9) 156 | (9) 180 | (9) 179 | (12) 173 |
| Grand Total | 244 | 253 | 275 | 310 | 313 | 317 |
Numbers in parentheses also included under another division indicate duplicates. These are omitted in the grand total.
Students by Curricula
| Curriculum | 1919-20 | 1920-21 | 1921-22 | 1922-23 | 1923-24 | 1924-25 |
|---|---|---|---|---|---|---|
| General Agriculture | 80 | …… | …… | …… | …… | …… |
| Agric'l Education | 42 | 17 | 43 | 50 | 60 | 62 |
| Agric'l Engineering | 3 | 3 | …… | 33 | 34 | 35 |
| Agronomy | …… | 47 | 44 | 37 | 41 | 42 |
| Animal Husbandry | …… | 44 | 47 | 27 | 32 | 26 |
| Dairy Husbandry | …… | 6 | 10 | 15 | 16 | 16 |
| Horticulture | 5 | 13 | 20 | 24 | 30 | 28 |
| Chemical Engin'g | 46 | 45 | 44 | 43 | 43 | 44 |
| Civil Engineering | 79 | 77 | 82 | 77 | 96 | 137 |
| Electrical Engineering | 173 | 182 | 198 | 217 | 250 | 270 |
| Mechanical Engineering | 131 | 130 | 128 | 109 | 127 | 120 |
| Mining Engineering | 13 | 21 | 29 | 19 | 39 | 25 |
| Agricultural Economics | …… | …… | …… | …… | …… | 1 |
| Business Administration | …… | …… | …… | …… | …… | 84 |
| Commercial Engineering | …… | …… | 26 | 41 | 62 | 60 |
| Industrial Education | …… | 29 | 37 | 34 | 35 | 20 |
| Secretarial Training | …… | …… | …… | …… | …… | 3 |
| General Science | 12 | …… | …… | …… | …… | …… |
| Biology | 12 | 17 | 14 | 14 | 15 | 21 |
| Chemistry | 9 | 6 | 20 | 11 | 11 | 16 |
| Geology | 2 | 3 | 6 | 7 | 7 | 5 |
| Metallurgy | 3 | 1 | 3 | 3 | 3 | 3 |
| Physics | 1 | …… | …… | …… | …… | …… |
| Pre-Dental | …… | …… | …… | …… | 4 | 8 |
| Pre-Law | …… | …… | …… | …… | 7 | 17 |
| Pre-Medical | …… | …… | 21 | 23 | 28 | 21 |
| Pre-Pharmacy | …… | …… | …… | …… | 2 | 0 |
| Prep. Veterinary Med | 0 | …… | …… | …… | …… | …… |
| 2-year Agriculture | 92 | 121 | 76 | 46 | …… | …… |
| 2-year Pract. Mechs. | …… | …… | …… | 7 | …… | …… |
| Vet. Bur. Spec. Agric. | 52 | 27 | 117 | 118 | 141 | 96 |
| Special & Unclassified | …… | 4 | 4 | 16 | 18 | 13 |
| Part-time Students | …… | …… | 6 | 6 | 9 | 18 |
| Totals | 755 | 793 | 975 | 977 | 1,110 | 1,191 |
Students by Class Groups
| Group | 1919-20 | 1920-21 | 1921-22 | 1922-23 | 1923-24 | 1924-25 |
|---|---|---|---|---|---|---|
| Graduate Students | 18 | 14 | 29 | 28 | 31 | 42 |
| Seniors | 88 | 88 | 129 | 125 | 148 | 179 |
| Juniors | 82 | 130 | 140 | 147 | 176 | 156 |
| Sophomores | 162 | 159 | 187 | 218 | 213 | 229 |
| Freshmen | 247 | 250 | 287 | 269 | 375 | 460 |
| 2d-year 2-year Agriculture | 18 | 37 | 35 | 19 | …… | …… |
| 1st-year, 2-year Agriculture | 74 | 84 | 41 | 27 | …… | …… |
| Vet. Bur. & Unclassified | 66 | 31 | 127 | 144 | 167 | 125 |
| Totals | 755 | 793 | 975 | 977 | ||
| Winter Short Course | 30 | 53 | 15 | 19 | …… | 21 |
| Summer Session | …… | …… | 141 | 196 | 228 | 177 |
| Totals for Year | 785 | 846 | 1,131 | 1,192 | 1,338 | 1,339 |
Note—Where a blank occurs in the tables on this page the curriculum was not offered; and where a cipher appears the curriculum was offered but no students were registered in it.
Students by States and Countries
| State or Country | 1919-20 | 1920-21 | 1921-22 | 1922-23 | 1923-24 | 1924-25 |
|---|---|---|---|---|---|---|
| Alabama | 2 | 2 | 2 | 0 | 1 | 1 |
| California | 0 | 1 | 1 | 2 | 1 | 0 |
| District of Columbia | 2 | 3 | 7 | 6 | 7 | 7 |
| Florida | 0 | 0 | 1 | 1 | 2 | 1 |
| Georgia | 2 | 1 | 2 | 7 | 4 | 5 |
| Indiana | 0 | 0 | 0 | 0 | 2 | 1 |
| Iowa | 0 | 0 | 0 | 0 | 0 | 1 |
| Kentucky | 5 | 3 | 2 | 2 | 5 | 11 |
| Louisiana | 0 | 0 | 0 | 0 | 0 | 2 |
| Maryland | 4 | 6 | 6 | 5 | 11 | 10 |
| Massachusetts | 0 | 2 | 3 | 1 | 2 | 1 |
| Michigan | 1 | 1 | 0 | 0 | 0 | 0 |
| Minnesota | 0 | 0 | 0 | 0 | 0 | 1 |
| Mississippi | 1 | 0 | 0 | 1 | 1 | 0 |
| New Jersey | 2 | 2 | 1 | 3 | 2 | 5 |
| New York | 0 | 0 | 2 | 4 | 5 | 2 |
| North Carolina | 3 | 5 | 5 | 7 | 13 | 11 |
| Ohio | 0 | 0 | 1 | 2 | 0 | 3 |
| Oklahoma | 0 | 0 | 0 | 0 | 1 | 1 |
| Pennsylvania | 1 | 4 | 8 | 6 | 8 | 8 |
| South Carolina | 7 | 4 | 4 | 3 | 3 | 3 |
| Tennessee | 3 | 4 | 6 | 9 | 10 | 8 |
| Texas | 1 | 2 | 2 | 0 | 0 | 0 |
| West Virginia | 18 | 17 | 25 | 31 | 28 | 28 |
| Wisconsin | 0 | 0 | 1 | 0 | 0 | 0 |
| Canada | 0 | 0 | 0 | 1 | 1 | 0 |
| China | 0 | 1 | 2 | 1 | 3 | 1 |
| Colombia | 0 | 0 | 0 | 0 | 0 | 1 |
| Hawaii | 0 | 0 | 0 | 0 | 1 | 0 |
| Mexico | 0 | 2 | 4 | 3 | 2 | 0 |
| Porto Rico | 2 | 1 | 1 | 0 | 0 | 0 |
| VIRGINIA | 701 | 732 | 889 | 882 | 997 | 1,079 |
| Totals | 755 | 793 | 975 | 977 | 1,110 | 1,191 |
Typical Annual Distribution of Virginia Students by Counties
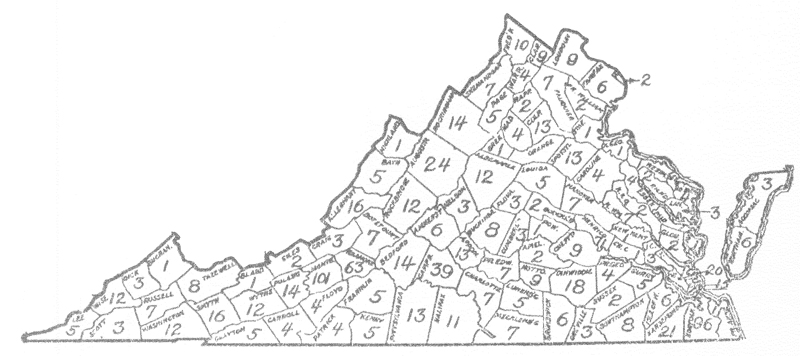
(The cities are included in the counties)
Graduates by Curricula
| Curriculum | 1919-20 | 1920-21 | 1921-22 | 1922-23 | 1923-24 | 1924-25 |
|---|---|---|---|---|---|---|
| General Agriculture | 21 | …… | …… | …… | …… | …… |
| Agricultural Education | 6 | 2 | 8 | 9 | 12 | 6 |
| Agricultural Engineering | …… | 3 | …… | 0 | 9 | 13 |
| Agronomy | …… | 2 | 5 | 6 | 2 | 7 |
| Animal Husbandry | …… | 5 | 13 | 8 | 5 | 4 |
| Dairy Husbandry | …… | 1 | 2 | 1 | 2 | 3 |
| Horticulture | 1 | 0 | 1 | 3 | 3 | 6 |
| Chemical Engineering | 8 | 11 | 10 | 3 | 7 | 7 |
| Civil Engineering | 9 | 16 | 13 | 18 | 8 | 18 |
| Electrical Engineering | 17 | 14 | 28 | 33 | 28 | 33 |
| Mechanical Engineering | 14 | 14 | 24 | 13 | 13 | 14 |
| Mining Engineering | 1 | 0 | 4 | 1 | 7 | 7 |
| Commercial Engineering | …… | …… | …… | 6 | 6 | 7 |
| Industrial Education | …… | 2 | 4 | 7 | 7 | 4 |
| Biology | 0 | 1 | 2 | 2 | 0 | 5 |
| Chemistry | 2 | 4 | 2 | 1 | 3 | 4 |
| Geology | 0 | 0 | 0 | 1 | 1 | 1 |
| Metallurgy | 0 | 0 | 1 | 0 | 0 | 2 |
| Totals | 79 | 75 | 117 | 112 | 113 | 141 |
Note—Where a blank occurs in this table the curriculum was not offered; and where a cipher appears the curriculum was offered but there was no graduate in it.
Graduate Degrees Conferred
| Degree | 1919-20 | 1920-21 | 1921-22 | 1922-23 | 1923-24 | 1924-25 |
|---|---|---|---|---|---|---|
| Master of Science | 3 | 4 | 8 | 4 | 9 | 6 |
| Chemical Engineer | 1 | 1 | 0 | 2 | 0 | 0 |
| Civil Engineer | 0 | 3 | 3 | 0 | 0 | 0 |
| Electrical Engineer | 2 | 0 | 3 | 3 | 2 | 2 |
| Mining Engineer (E. M.) | 0 | 0 | 0 | 0 | 0 | 0 |
| Mechanical Engineer | 1 | 0 | 3 | 3 | 0 | 2 |
| Totals | 7 | 8 | 17 | 12 | 11 | 10 |
Extension Enrolment
| 1923-24 | 1924-25 | |
|---|---|---|
| Farm Women as Demonstrators | …… | 8,226 |
| Farmers as Demonstrators | 12,265 | 14,765 |
| Farm Women in Clubs | 2,415 | 2,077 |
| Farmers in Clubs | 5,353 | 6,188 |
| Boys in Agricultural Clubs | 7,972 | 6,667 |
| Girls in Home Economics Clubs | 6,819 | 7,672 |
| Boys and Girls in Summer Camp Courses | 2,270 | 2,055 |
| Farmers in Tractor Short Courses | 65 | …… |
| Boys in Farm Mechanics Courses | 127 | …… |
| Institute and Conference Attendance | 116,757 | 151,360 |
1919-1929 Reports
Early President's Reports were published in bulletins, with multiple reports in each bulletin. Note that the original spelling of many words (enrolment, remodelling, etc.) has been retained.
1927-1928, 1928-1929 Reports
Introduction
1927-1928 -- General Report
1928-1929 -- General Report
Appendix
Enrolment Statistics
Summary of Treasurer's Reports
1925-26, 1926-27 Reports
1925-1927 Introduction
1925-1926 -- General Report
1926-1927 -- General Report
Appendix
Appointments, Tenure, and Salaries
Vacations, Office Hours, Records, etc.
Enrolment Statistics
Summary of Treasurer's Reports